Monitoring
GovWifi uses a number of monitoring tools and scheduled jobs to collect metrics, monitor service health, and generate usage reports.
This page describes how monitoring works across Grafana, Prometheus, Google Analytics, and the related Rake tasks.
Key Performance Metrics and Reporting
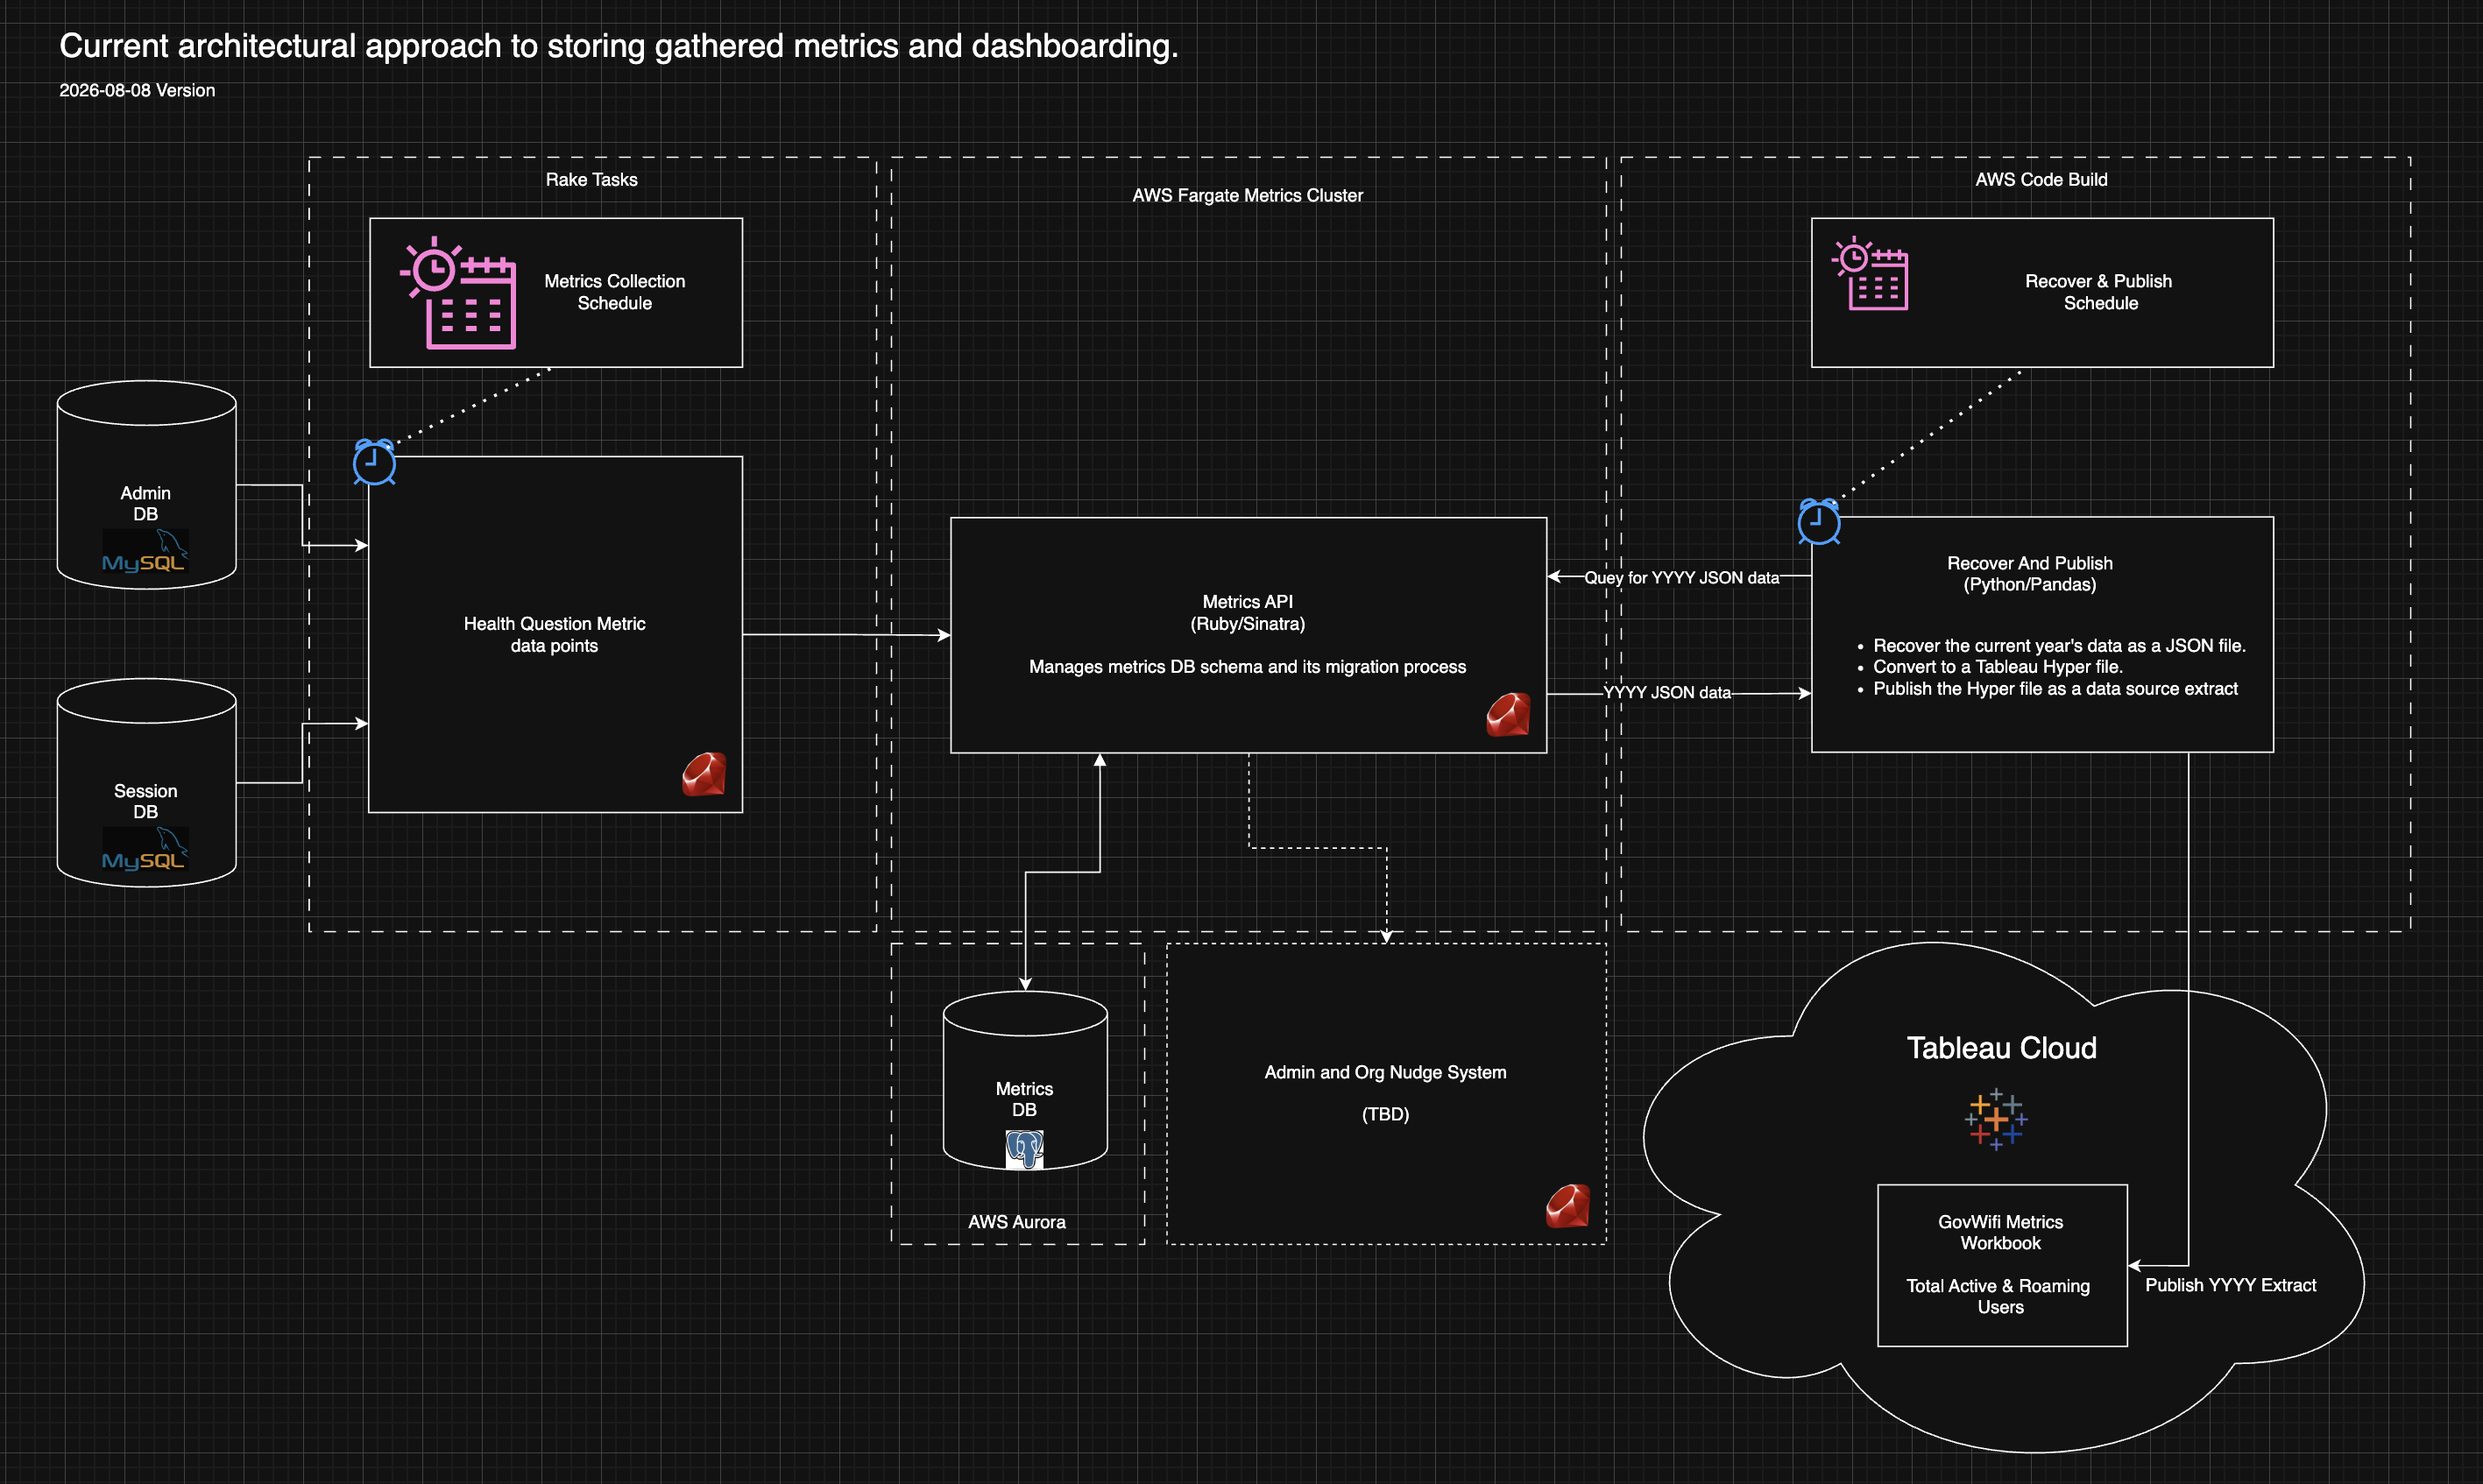
This system surfaces key performace metrics in Tableau dashboard in order for leaders and stakeholders to understand how the service is performing and to make data-driven decisions.
Currently, this system gathers metrics on active and roaming users, publishes them to a central Metrics API, and updates a Tableau Cloud data source daily. Tableau workbooks and dashboards are built on top of that data source to provide performance insights for the service.
GovWifi Production Active and Roaming Users Tableau Dashboard
Future plans include adding account health metrics to keep IT administrators compliant with GovWifi terms and conditions.
The Architecture Diagram can be seen here on Google Drive
See the explanation video of the system on the Google team drive
See the demonstration video of the system on the Google team drive
End-to-End Flow
The pipeline runs in two sequential phases each day:
Phase 1 — Metric collection (daily at 05:00 UTC)
An ECS scheduled task in the Logging API runs bundle exec rake publish_daily_total_metrics. It queries the sessions database and POSTs four rolling metrics to the Metrics API:
| Metric name (stored in API) | Display name in Tableau |
|---|---|
monthly-rolling-window-total-active-users |
Active Users |
monthly-rolling-window-total-roaming-users |
Roaming Users |
month-to-date-total-active-users |
Active Users (MTD) |
month-to-date-total-roaming-users |
Roaming Users (MTD) |
The source code for the collection logic is in govwifi-logging-api:
- Task:
tasks/recover_active_users.rb - Sender:
lib/performance/metrics/daily_metrics_sender.rb - API client:
lib/performance/metrics/metrics_api_publisher.rb
The Logging API task is triggered by the <env>-daily-metrics-logging CloudWatch Event Rule (see govwifi-terraform/govwifi-api/event-rules.tf).
Phase 2 — Tableau publication (daily at 07:05 UTC)
An AWS EventBridge Scheduler named metrics-recover-and-publish-schedule (cron 05 7 * * ? *) triggers the CodeBuild project tableau-data-source-publication. That project:
- Clones the
govwifi-metrics-data-publisherrepository from GitHub - Builds a Docker image from the repository
- Runs the
recover_and_publishCLI command inside the container, which:- Calls
GET /v1/data/export?year=<current_year>on the Metrics API to download the full year’s data as JSON - Converts the JSON to a Tableau Hyper extract using
pantab - Authenticates to Tableau Cloud using a Personal Access Token (PAT) and publishes the Hyper extract, overwriting the existing data source named
<year> <Environment> GovWifi Data(e.g.2026 Production GovWifi Data)
- Calls
The 07:05 UTC start time gives Phase 1 two hours to complete before Phase 2 reads the data.
Components
Metrics API (govwifi-metrics-api)
A Ruby/Sinatra application running on AWS ECS Fargate, backed by an Aurora PostgreSQL Serverless v2 cluster. It is the central store for all Tableau metrics.
URL: https://metrics.<env_subdomain>.service.gov.uk
Key endpoints:
| Endpoint | Auth required | Purpose |
|---|---|---|
GET /health |
No | Health check — verifies DB connectivity |
POST /v1/record |
Bearer token | Record a single metric data point |
GET /v1/data/export |
Bearer token | Export metric records as a JSON file, with optional filters (year, month, from, to, name) |
The metrics table has a composite unique index on (name, datetime), so duplicate records are rejected with a 422 response.
Infrastructure is defined in govwifi-terraform/govwifi-metrics/.
Metrics Data Publisher (govwifi-metrics-data-publisher)
A Python CLI package with three commands:
| Command | What it does |
|---|---|
recover |
Downloads a year (or year + month) of metric data from the Metrics API as a JSON file |
metpub |
Converts a JSON file to a Hyper extract and publishes it to Tableau Cloud |
recover_and_publish |
Runs recover then metpub in sequence — this is the command used in production |
Tableau Cloud
The published data source appears under the project folder named in the PROJECT_NAME secret. Workbooks built against it will reflect the overwritten data after each daily publication.
Scheduled Tasks Summary
| Schedule | What runs | Where defined |
|---|---|---|
| Daily at 05:00 UTC | rake publish_daily_total_metrics (Logging API ECS task) |
govwifi-terraform/govwifi-api/event-rules.tf |
| Daily at 07:05 UTC | CodeBuild project tableau-data-source-publication (recover_and_publish) |
govwifi-terraform/govwifi-metrics/codebuild.tf |
AWS Infrastructure
All Metrics infrastructure lives in the govwifi-terraform/govwifi-metrics/ Terraform module:
| Resource | Name / pattern | Purpose |
|---|---|---|
| ECS Cluster | <env_name>-metrics-cluster |
Runs the Metrics API Fargate task |
| ALB | metrics-alb-<env> |
Routes HTTPS traffic to the Metrics API |
| Aurora PostgreSQL (Serverless v2) | metrics-db-cluster-<region>-<env> |
Metrics data store |
| CodeBuild project | tableau-data-source-publication |
Builds and runs the data publisher |
| EventBridge Scheduler | metrics-recover-and-publish-schedule |
Triggers CodeBuild daily at 07:05 UTC |
| CloudWatch Log Group | metrics-api-log-group-<env> |
Metrics API container logs |
| CloudWatch Log Group | govwifi-metrics-data-publisher-group |
CodeBuild run logs (stream: govwifi-metrics-data-publisher-stream) |
| S3 bucket | govwifi-tableau-publication-logs-<env> |
CodeBuild build logs and artifacts |
| S3 bucket | govwifi-metrics-access-logs-<env> |
ALB access logs |
Secrets Management
All secrets are stored in AWS Secrets Manager:
| Secret name | Contents | Used by |
|---|---|---|
govwifi/metrics-api/key |
API Bearer token | Metrics API (auth enforcement), Logging API (posting metrics), CodeBuild (recovery export) |
govwifi/metrics-data-publisher/tableau |
JSON with TOKEN_NAME, TOKEN_VALUE, SITE_ID, SERVER_URL, PROJECT_NAME |
CodeBuild — passed as environment variables to the publisher container |
metrics/db/credentials |
JSON with username and password |
Metrics API ECS task |
Rotating the Tableau Personal Access Token
Tableau Cloud PATs expire approximately every year. When the token expires the CodeBuild job will fail with an authentication error. To rotate it:
- Log in to Tableau Cloud and generate a new PAT (Settings → Personal Access Tokens).
- Update the
govwifi/metrics-data-publisher/tableausecret in AWS Secrets Manager with the newTOKEN_NAMEandTOKEN_VALUE. - Trigger the CodeBuild project manually (see below) to verify the new token works.
Monitoring and Troubleshooting
Checking whether the daily publication succeeded
- In the AWS Console, navigate to CodeBuild → Build projects →
tableau-data-source-publication. - Check the most recent build. A green tick means success; a red cross means failure.
- For detailed logs, open the build and inspect the Phase details and Build logs tabs, or query the CloudWatch Log Group
govwifi-metrics-data-publisher-group.
You can also check S3 bucket govwifi-tableau-publication-logs-<env> under the prefix metrics-data-publisher-log.
Checking whether metric collection succeeded
Check the Logging API ECS task logs in CloudWatch under the log group for the Logging API, filtered to the stream prefix <env_name>-logging-api-docker-logs. Look for log entries from the publish_daily_total_metrics task. A successful run will emit lines like:
BEGIN: [monthly_rolling_total-day-2026-06-25] Fetching and uploading metrics...
END: [monthly_rolling_total-day-2026-06-25] Done.
A warning line such as Metrics API upload failed means the Metrics API was unreachable or returned an error.
Checking Metrics API health
curl https://metrics.<env_subdomain>.service.gov.uk/health
A healthy response returns {"status":"OK","database":"connected"}. A 503 response means the Aurora database is down or unreachable.
Manually triggering a Tableau publication
If the scheduled run fails or needs to be re-run:
- In the AWS Console, open CodeBuild →
tableau-data-source-publicationand choose Start build. - The build will clone the repository, build the image, and run
recover_and_publishfor the current calendar year.
Manually exporting metrics data from the API
To inspect or download the raw data held in the Metrics API:
# Export all data for a given year
curl -H "Authorization: Bearer <api_key>" \
  "https://metrics.<env_subdomain>.service.gov.uk/v1/data/export?year=2026"

# Export a specific month
curl -H "Authorization: Bearer <api_key>" \
  "https://metrics.<env_subdomain>.service.gov.uk/v1/data/export?year=2026&month=5"
The response is a downloadable JSON array of metric records.
Grafana
Grafana is an open-source analytics and monitoring platform used to monitor the health of GovWifi in real time.
Every GovWifi environment has its own Grafana instance, running on AWS EC2.
This Google Document contains in-depth information on the technical setup (you must be a member of the GovWifi team to view this document).
You can access the dashboards using the links below (VPN and dashboard access required):
Where the Data Comes From / Grafana Data Sources
The data in Grafana primarily comes from Prometheus and Elasticsearch, both hosted in AWS.
- Prometheus collects data from the Radius servers (for example, authentication requests over time).
This data is more fine-grained and typically used by engineers. - Elasticsearch provides higher-level usage insights and generates monthly reports sent to GPA.
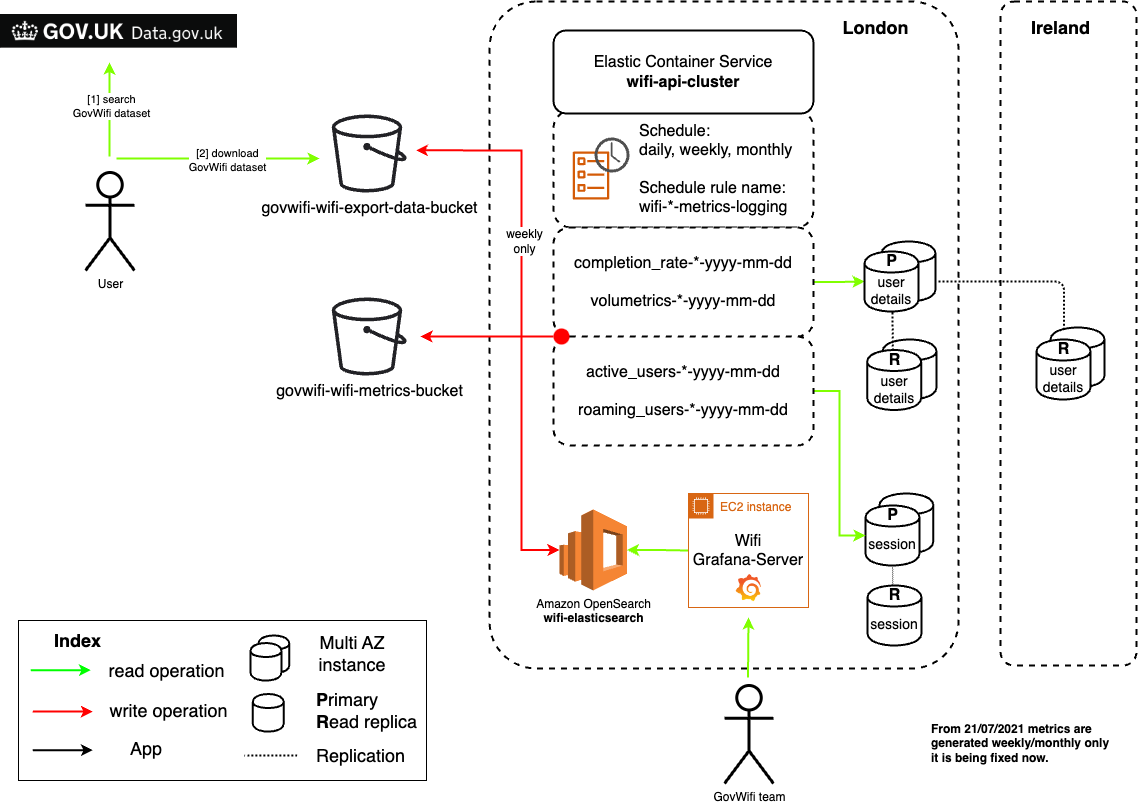
Elasticsearch
The admin and logging-api applications collect and push a range of metrics (such as active users and completion rates) to our Elasticsearch cluster in AWS.
Data is pulled from databases at regular intervals (hourly, daily, monthly, etc.) and sent to Elasticsearch via ECS scheduled jobs.
These scheduled jobs run Rake tasks that push data to Elasticsearch at specific intervals.
See this example Terraform job.
The metrics are also backed up in an S3 bucket in each GovWifi environment. This is configured by the govwifi-dashboard module in terraform. The diagram below shows the resources that Elasticsearch interacts with. A scalable version is available in our team drive:
Using Grafana Data to Generate Monthly Reports
The GovWifi team uses Grafana metrics to generate monthly reports.
Detailed instructions can be found here (GovWifi access required).
Hosted on GOV.UK PaaS (Platform as a Service)
Prior to November 2023, an additional Grafana instance was hosted on GOV.UK PaaS.
It monitored performance of the GovWifi Product Pages and Tech Docs.
This data is now collected via Google Analytics. The PaaS was scheduled for decommissioning in December 2023, and the Product Pages and Tech Docs are now hosted on GitHub Pages.
Rake Tasks
A number of Rake tasks are used to collect and publish metrics that feed into Grafana dashboards and monthly reports.
These tasks run automatically as ECS scheduled jobs in AWS, but can also be triggered manually if needed.
Logging API Tasks
The Logging API defines several tasks under the Performance::Metrics module.
Each task generates and uploads a specific set of metrics to S3 and Elasticsearch using the Performance::Metrics::MetricSender class.
Metrics collected
| Metric | Use Case Class | Destination |
|---|---|---|
| active_users | Performance::UseCase::ActiveUsers |
S3 / Elasticsearch |
| completion_rate | Performance::UseCase::CompletionRate |
S3 / Elasticsearch |
| inactive_users | Performance::UseCase::NewUsers |
S3 / Elasticsearch |
| roaming_users | Performance::UseCase::RoamingUsers |
S3 / Elasticsearch |
| volumetrics | Performance::UseCase::Volumetrics |
S3 / Elasticsearch |
| user_devices | Performance::UseCase::UserDevices |
S3 / Elasticsearch |
These tasks are invoked by scheduled jobs defined in Terraform (see logging-scheduled-tasks.tf).
The metrics are visualised in Grafana and used in monthly reports.
Admin Application Tasks
The Admin application defines a Rake namespace opensearch for publishing metrics to OpenSearch (previously Elasticsearch).
Task
rake opensearch:publish_metrics
Purpose
Collects usage data about organisations and locations, then writes the results to the govwifi-metrics index in OpenSearch.
Data collected
| Metric | Use Case Class | Description |
|---|---|---|
| organisation_usage_stats | UseCases::OrganisationUsage |
Usage per organisation |
| new_organisations | UseCases::NewOrganisations |
New organisations signing up |
| new_locations | UseCases::NewLocations |
Newly added locations |
| new_cba_organisations | UseCases::NewCbaOrganisations |
New CBA organisations added |
Google Analytics
We currently have a Google Analytics dashboard which shows a summary of visits to our Product Page and Admin site.
There is an additional dashboard which used to allow for more detailed investigations of how people used these pages. However, this dashboard is currently broken.
Prometheus
Prometheus is an
open source software application used for event monitoring and
alerting. It records real-time metrics in a time series database built
using a HTTP pull model, with flexible queries and real-time alerting.
We run a Prometheus server which scrapes metrics from Prometheus log
exporters running on the FreeRADIUS containers.
These Prometheus exporters provide a wide range of information about
the actual FreeRADIUS server state and the packages being processed.
The information is used for diagnostics and tracking service
availability.
If you have SSM access, you can run the commands below to see the
dashboard. If not, please speak to the reliability engineers on the
team about access.
The previous SSH method is in the process of being deprecated and will be removed soon, advise to setup SSM access.
ssh -L 9090:127.0.0.1:9090 prometheus.<env>.govwifi
The below code gets the instance ID and uses it to start tunnel session via SSM, update the example with the Server name and region.
INSTANCE_ID=$(gds aws govwifi-development -- aws ec2 describe-instances --filter "Name=tag:Name,Values=<ENV> Prometheus-Server" --query "Reservations[].Instances[?State.Name == 'running'].InstanceId[]" --region <region> --output text)
gds aws govwifi-<env> -- aws ssm start-session --target $INSTANCE_ID --document-name AWS-StartPortForwardingSession --parameters '{"portNumber":["9090"],"localPortNumber":["9090"]}' --region <region>
eg for Dev London
INSTANCE_ID=$(gds aws govwifi-development -- aws ec2 describe-instances --filter "Name=tag:Name,Values=Alpaca Prometheus-Server" --query "Reservations[].Instances[?State.Name == 'running'].InstanceId[]" --region eu-west-2 --output text)
gds aws govwifi-development -- aws ssm start-session --target $INSTANCE_ID --document-name AWS-StartPortForwardingSession --parameters '{"portNumber":["9090"],"localPortNumber":["9090"]}' --region eu-west-2
After running the command you should be able to access the Prometheus
dashboard by entering the following address in your browser: